Power BI / FIG. D8 · PERSONAL DATA
Spotify Streaming History
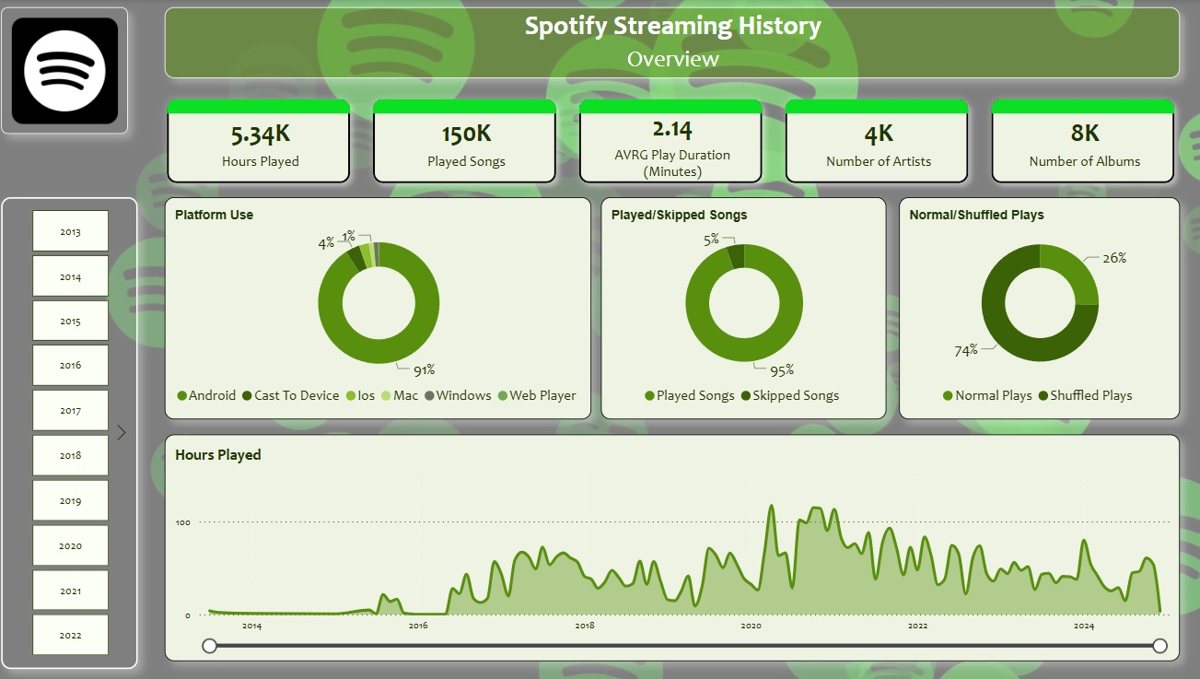
My own Spotify listening history, turned into a personal dashboard of habits, changing taste and forgotten favourites.
- SOURCE
- My own Spotify data export
- DATA
- Every play, with skip and shuffle flags
- OBJECTIVES
- 15, in 5 groups
- BUILT WITH
- Star schema · DAX time intelligence
01 · THE QUESTION
What do my listening habits say about me?
A streaming log is a long list of plays. The report was built around 15 questions about how, when and what I listen to.
- Q1Who are my top artists and songs, and how has that changed year on year?
- Q2When do I listen, on which platform, and why do tracks start or end?
- Q3Do I explore new artists or replay old favourites?
- Q4How do weekdays differ from weekends?
- Q5Which songs did I love once but rarely play now?
02 · THE DATA & CLEANING
From raw files to clean tables
Spotify's export of my streaming history: track, artist, album, timestamp, platform, how each track started and ended, and skip and shuffle flags.
- a.Parsed timestamps into date, hour and weekday.
- b.Turned true/false skip and shuffle values into usable flags.
- c.Made data types consistent across tables.
- d.Built a date table for time intelligence.
03 · THE DATA MODEL
One fact table, described by its look-ups
FACT
Plays
DIMENSIONS
- Date
- Artists
- Albums
- Platform
- Start / end reason
04 · REPORT PAGES
What's in the report
- P1Artists & songsTop artists and songs by listening time, year-on-year change and skip rates.
- P2RoutineListening by hour and day, platforms used, and reasons tracks start or end.
- P3ExplorationNew versus familiar artists and the monthly rate of new music discovery.
- P4HabitsWeekday versus weekend listening and the "forgotten gems" list.
- P5TotalsTotal listening time and total songs played.
05 · FINDINGS
What the report reveals
- Whether top artists and genres change over time, showing how taste shifts.
- The hours and days with the most listening.
- Which tracks I play through and which I skip, separating favourites from filler.
- Whether I lean toward discovery or familiar favourites.
- Songs I used to play often but have stopped playing.
06 · RECOMMENDATIONS
What to do next
- 01Use peak hours on purpose, for focus or for rest.
- 02Make room for new artists if discovery is low.
- 03Bring the forgotten gems back into rotation.
07 · TECHNICAL CHALLENGES
Problems solved along the way
- CHALLENGE 1Time in every directionHours, weekdays, months and years needed a full date table and custom DAX time measures.
- CHALLENGE 2Raw data to clean dataTimestamps, true/false flags and mixed types were cleaned before modelling.
- CHALLENGE 3A heat map without clutterConditional formatting shows listening intensity by hour without filling the grid with numbers.
- CHALLENGE 4A scalable modelA star schema links artists, albums and reasons to the plays table with the right cardinality.
See it for yourself.
Open the live report →