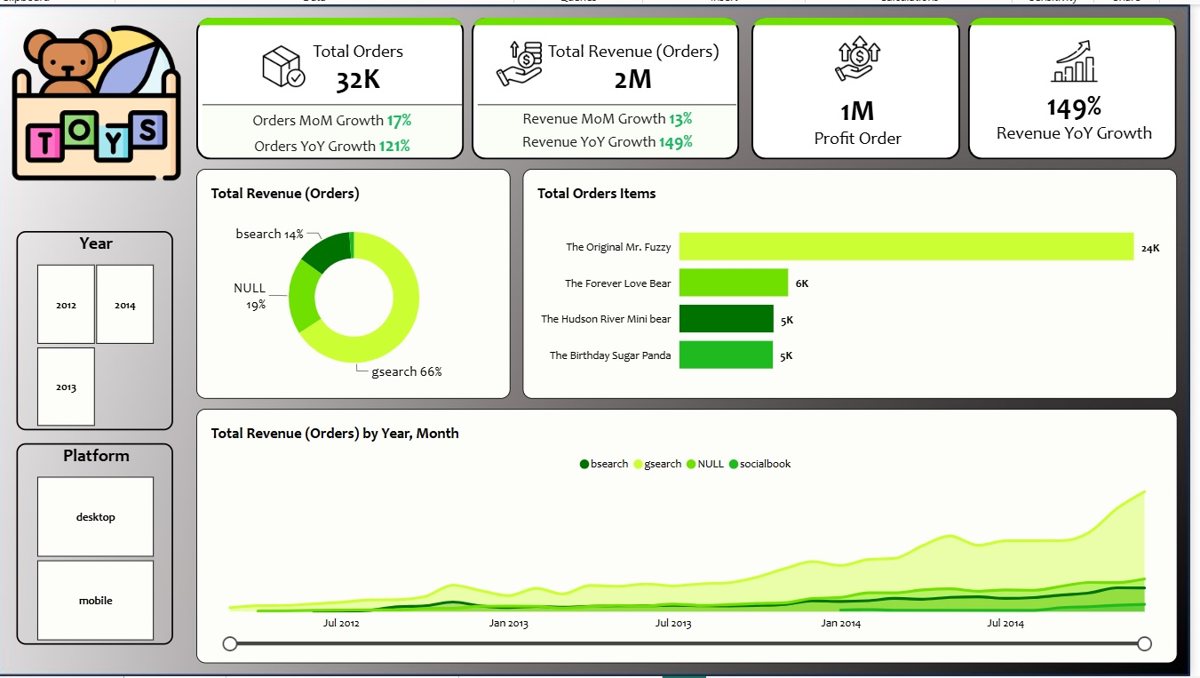
FIG. D1 · E-COMMERCE
Toy Store E-commerce
Traffic, conversion, revenue, profit and customer loyalty for an online toy store.
POWER BI · DATA ANALYSIS
It's the key to insights, better decisions and what comes next.
I believe in the power of data to uncover insights, tell clear stories and drive real decisions. I enjoy turning raw information into knowledge teams can act on, helping them find a smarter route to their goals.
Below are nine reports built from public datasets, each taken from raw files to a finished, interactive report. Open any of them to explore it live.
FIG. D1 · E-COMMERCE
Traffic, conversion, revenue, profit and customer loyalty for an online toy store.
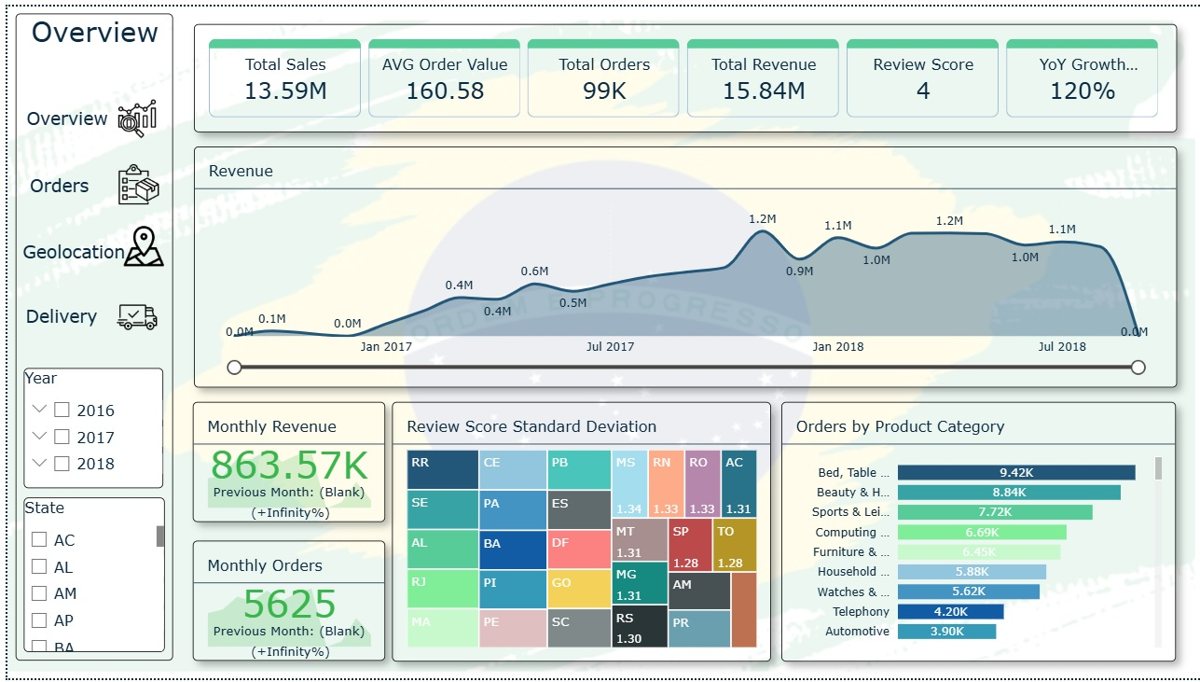
FIG. D2 · E-COMMERCE
The Olist marketplace: sales, delivery performance and customer reviews.
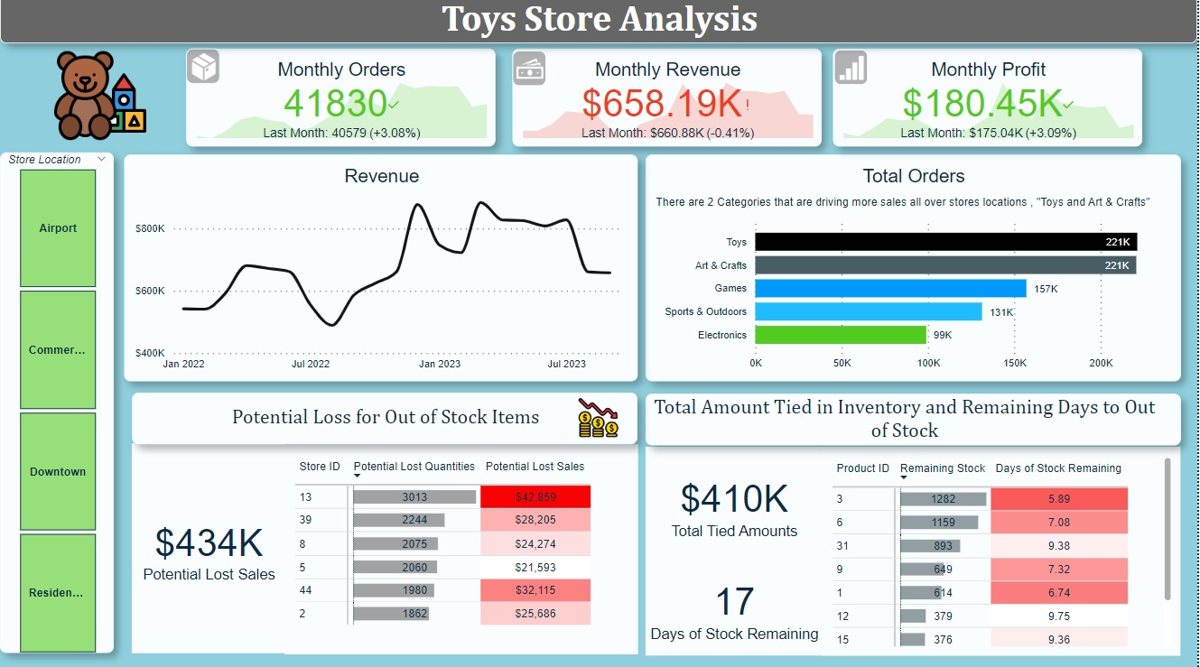
FIG. D3 · RETAIL
Sales and inventory across a chain of toy stores.
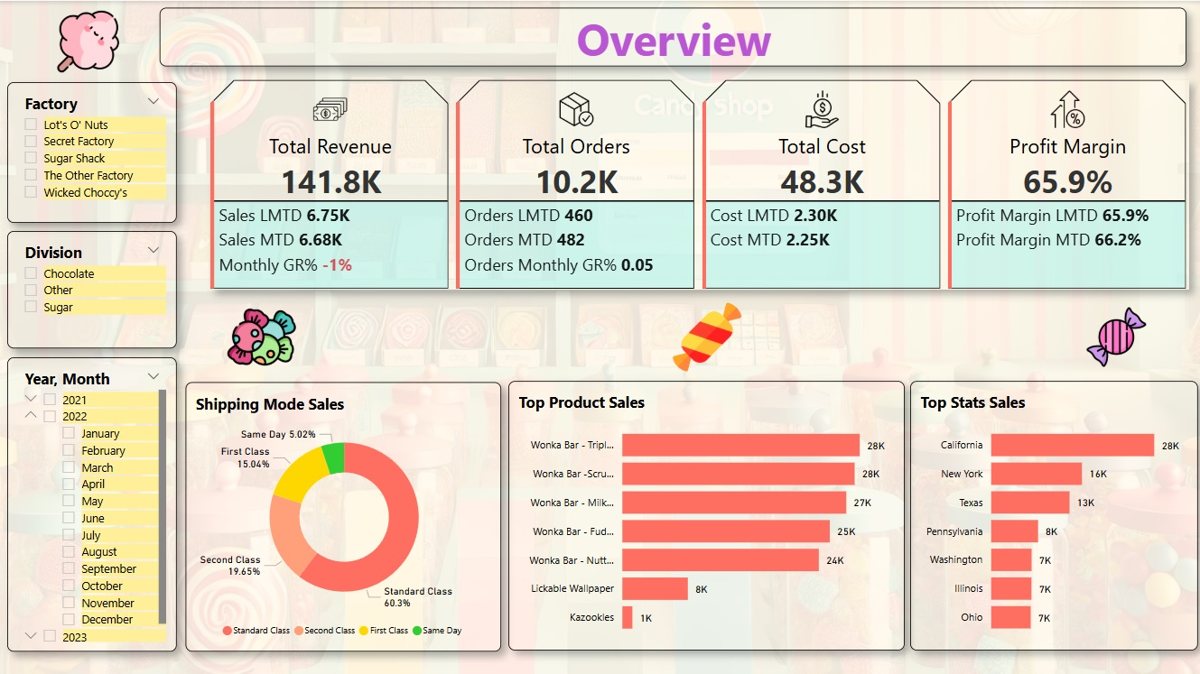
FIG. D4 · SALES
Revenue, orders, costs and margins by product, factory and region.
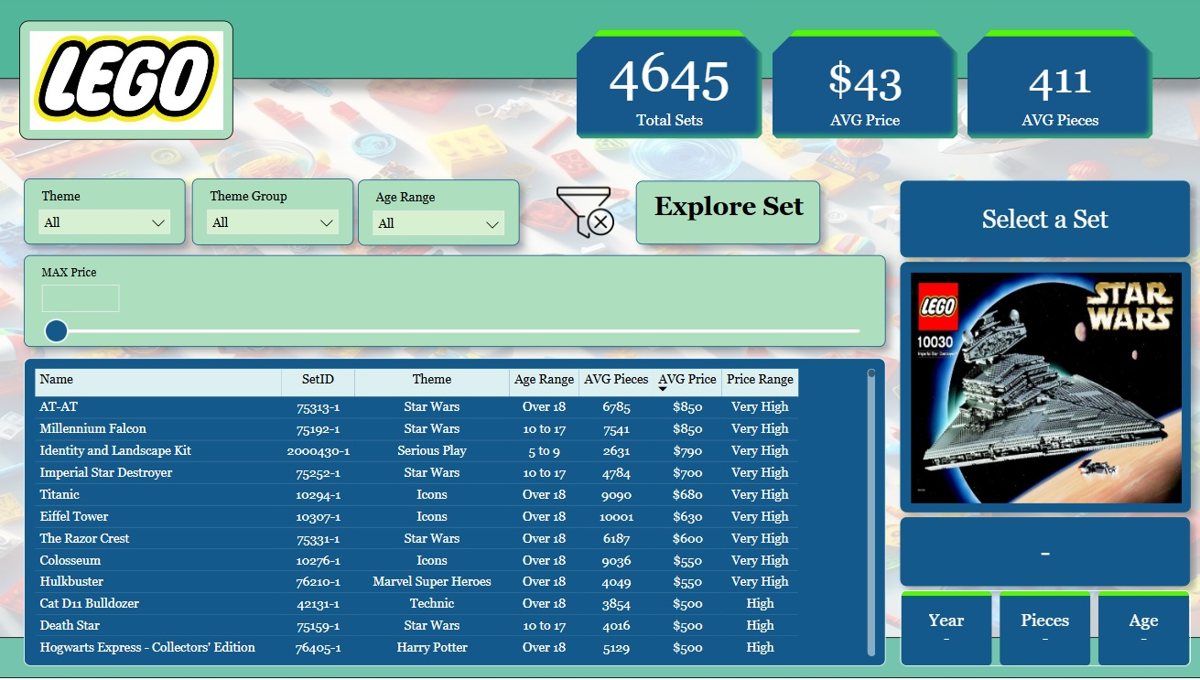
FIG. D5 · PRODUCTS
Fifty years of LEGO sets: themes, pricing and age targeting from 1970 to 2022.
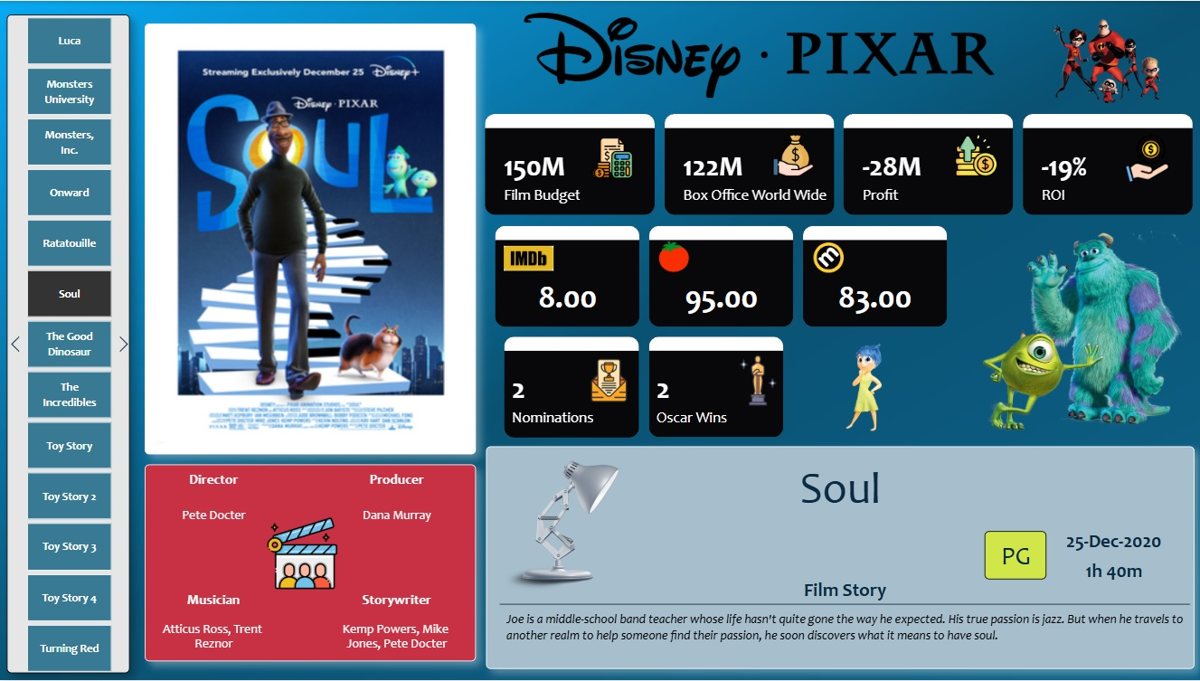
FIG. D6 · FILM
Box office, critical reception, production and creative teams across Pixar films.
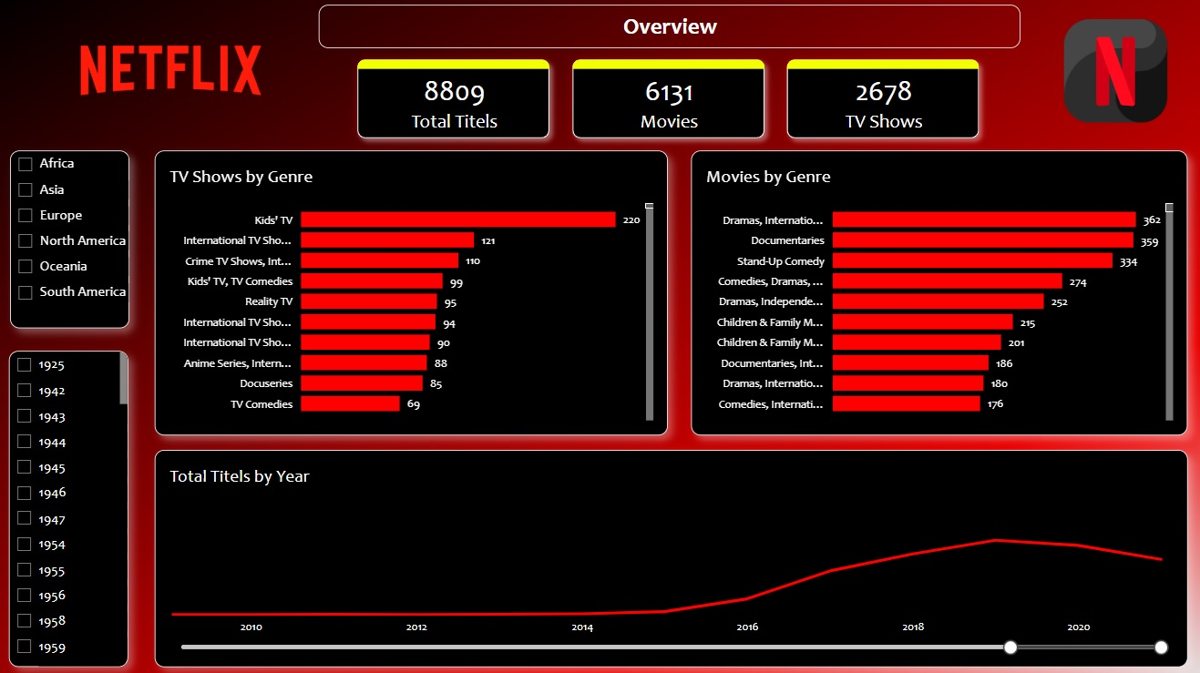
FIG. D7 · MEDIA
Content trends in the Netflix catalogue and what they suggest for the business.
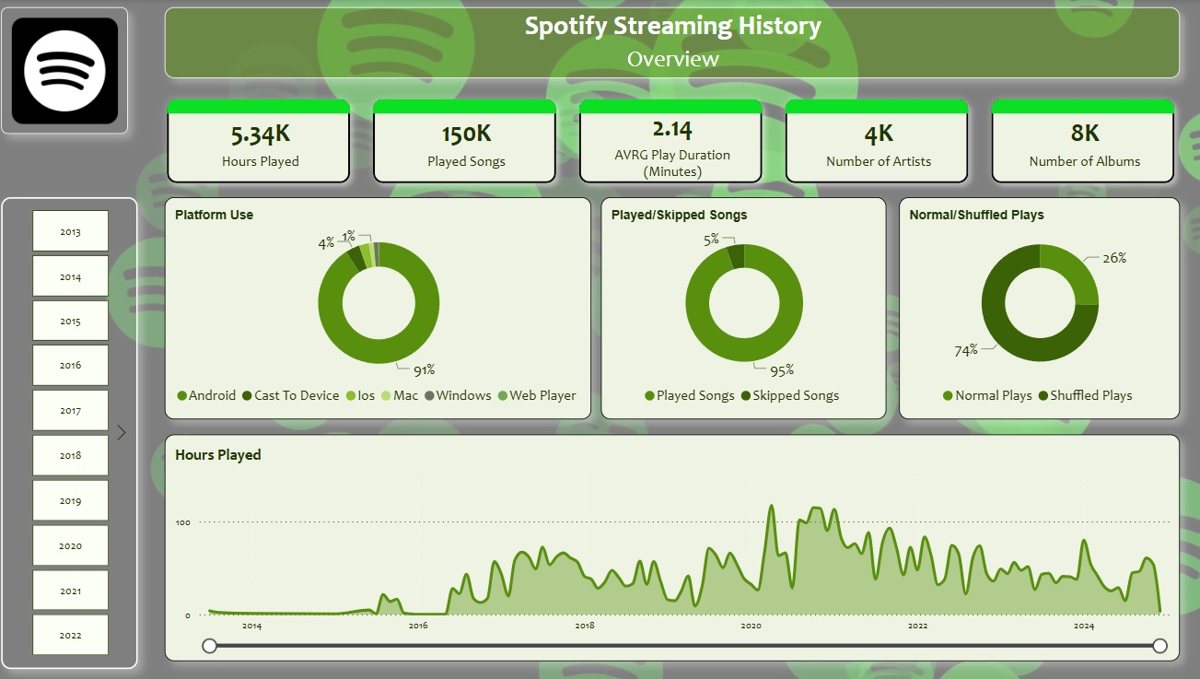
FIG. D8 · PERSONAL DATA
Listening habits, changing taste and forgotten favourites from a streaming log.
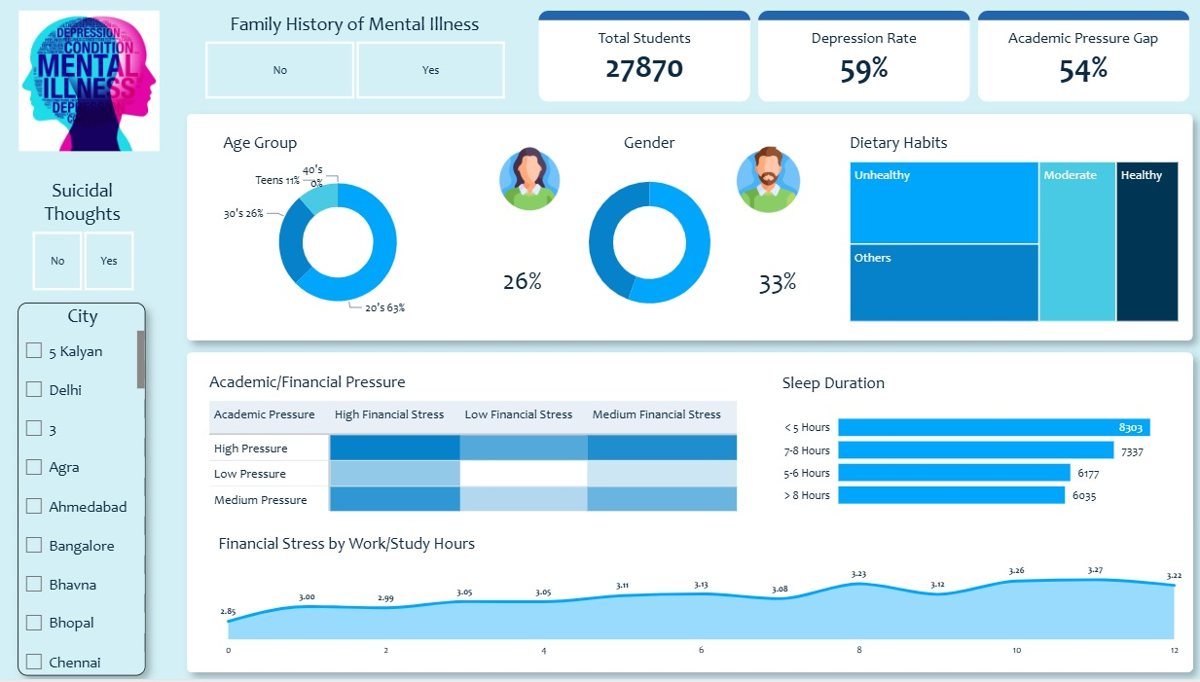
FIG. D9 · EDUCATION
Factors linked to depression across 27,901 student records.