Power BI / FIG. D3 · RETAIL
Toy Stores Analysis
Sales and stock for a chain of toy stores in Mexico, turned into a plan for what to restock, where and when.
- SOURCE
- Maven Analytics · Maven Toys
- DATA
- Products, stores, calendar, sales, inventory
- STORE TYPES
- Airport · Commercial · Downtown · Residential
- BUILT WITH
- Power Query · DAX
01 · THE QUESTION
Keep popular toys on the shelf without tying up cash
Maven Toys needed to balance two costs: empty shelves that lose sales, and excess stock that ties up money. The report had to show both, by store and by product.
- Q1Which products and categories sell most, and in which months?
- Q2How much revenue is at risk because items are out of stock?
- Q3How do stores and location types differ?
- Q4How many days of stock are left, and what should be reordered first?
02 · THE DATA & CLEANING
From raw files to clean tables
Five tables: products (cost and price), stores (city and location type), calendar, daily sales transactions and current stock per store.
- a.Profiled each table and fixed missing values, inconsistencies and outliers.
- b.Joined sales to products to get price, cost and profit per sale.
- c.Compared stock on hand with sales speed to estimate days left before stock runs out.
- d.Valued the expected shortfall to estimate potential lost sales per store.
- e.Used the calendar table for monthly and seasonal trends.
03 · THE DATA MODEL
One fact table, described by its look-ups
FACT
Sales & inventory
DIMENSIONS
- Products
- Stores
- Calendar
04 · REPORT PAGES
What's in the report
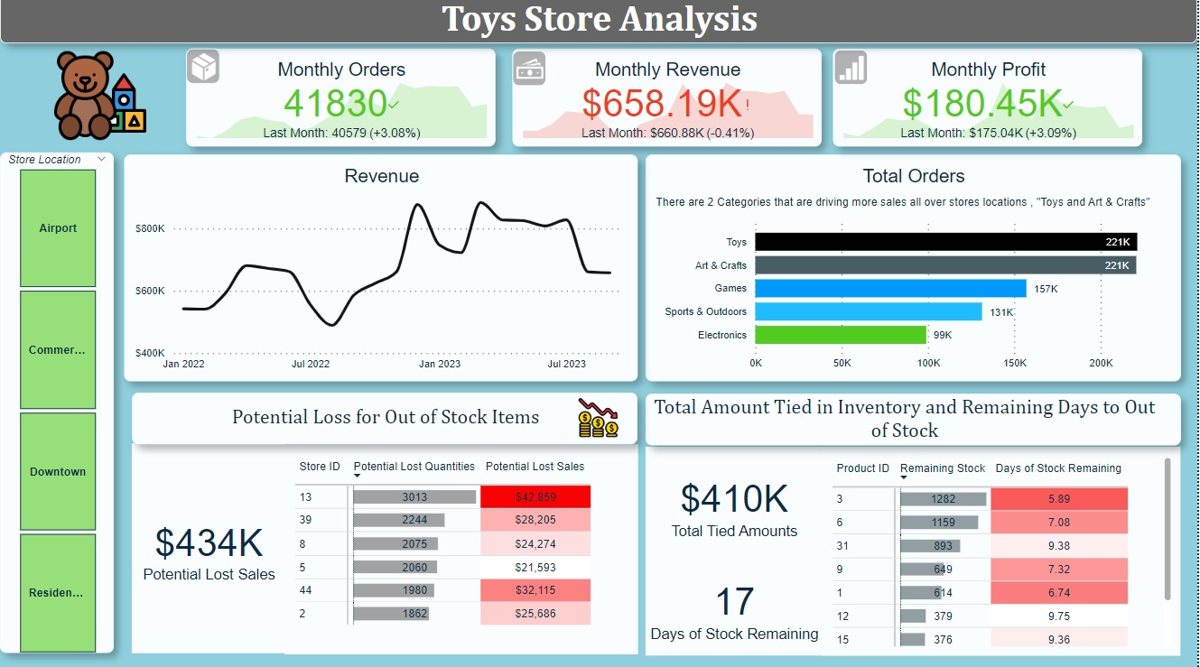
- P1PerformanceMonthly orders, revenue and profit, with a store-location filter to compare airport, commercial, downtown and residential stores.
- P2DemandOrders by category and the revenue trend through the year, showing peak months.
- P3Stock riskPotential lost sales from out-of-stock items, broken down by store and product.
- P4InventoryTotal value tied up in stock and the days remaining before items run out.
05 · FINDINGS
Key findings
- Out-of-stock items put about $434K in potential sales at risk.
- A typical month brings 41,830 orders, $658.19K revenue and $180.45K profit.
- About $410K is tied up in stock, roughly 17 days of supply overall.
- Toys and Art & Crafts lead all categories with about 221K orders each.
- December and March are the peak months.
- Stores 13, 44, 39, 2 and 8 carry the largest losses; store 13 alone has $42,659 at risk.
06 · RECOMMENDATIONS
What to do next
- 01Invest more in the Toys and Art & Crafts lines.
- 02Build stock ahead of the December and March peaks.
- 03Fix inventory at stores 13, 44, 39, 2 and 8 first.
- 04Reorder products 3, 6, 9, 1, 28 and 16 first; product 3 has only 5.89 days of stock left.
07 · TECHNICAL CHALLENGES
Problems solved along the way
- CHALLENGE 1Stock as a risk, not a numberStock on hand means little alone. Dividing it by average daily sales turns it into days left, which anyone can act on.
- CHALLENGE 2Putting a price on empty shelvesShortfalls were valued at selling price, so the loss is shown in dollars per store, not units.
- CHALLENGE 3Comparing unlike storesThe location-type filter lets an airport store be compared with other airport stores, not with a downtown one.
See it for yourself.
Open the live report →