Power BI / FIG. D4 · SALES
Candy Distributor
Revenue, orders, cost and margin for a US candy distributor, split by product, factory, division and state.
- SOURCE
- Maven Analytics · US candy distributor
- DATA
- Sales, products, factories, US zip codes
- PAGES
- 3
- BUILT WITH
- Power Query · star schema · maps
01 · THE QUESTION
Where does the money come from, and where does margin go?
A distributor ships many products from several factories across the US. The report had to show overall health, where products go and what really drives profit.
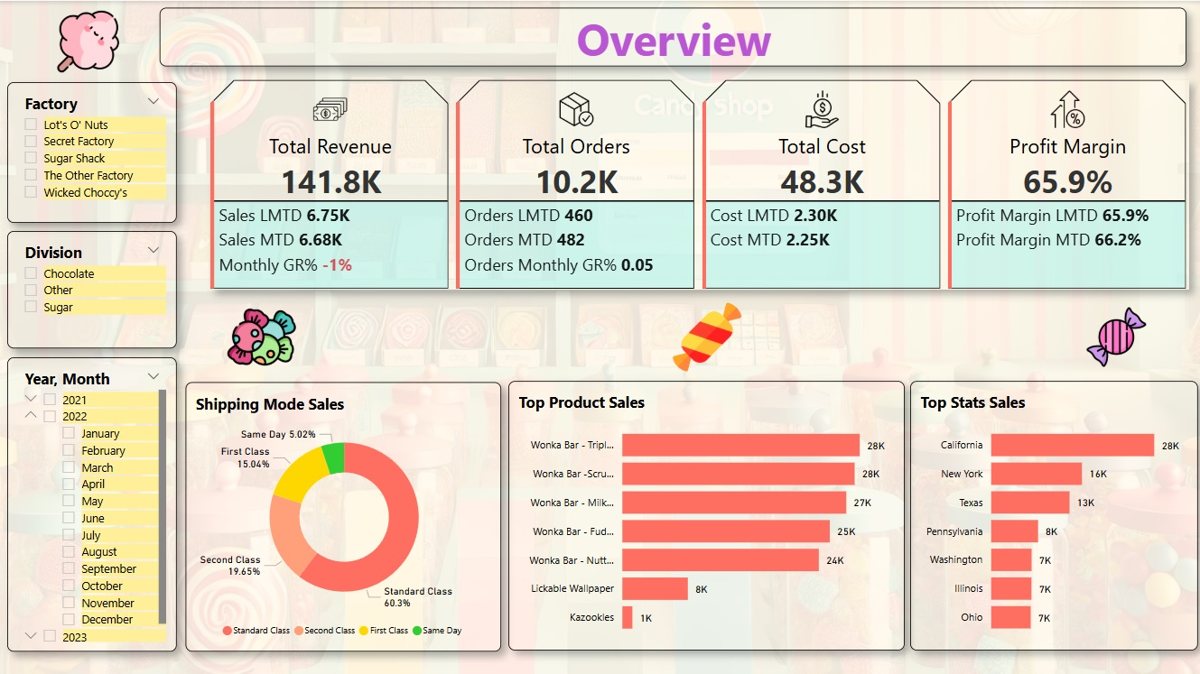
- Q1What are total revenue, orders, costs and profit margin, and how are they trending?
- Q2Which products and states sell most?
- Q3How are sales split across shipping modes?
- Q4Which years, divisions, products and factories earn the best margin?
02 · THE DATA & CLEANING
From raw files to clean tables
Several source files: sales and orders, product details, factories and a US zip-code table for mapping.
- a.Removed duplicates and formatted dates.
- b.Made naming consistent across files.
- c.Combined sales, factories and products into one clean dataset.
- d.Built a dedicated date table for time analysis.
03 · THE DATA MODEL
One fact table, described by its look-ups
FACT
Sales
DIMENSIONS
- Products
- Factories
- Date
- State
- US zip codes
04 · REPORT PAGES
What's in the report
- P1OverviewCards for revenue, orders, cost and profit margin, with sales by shipping mode, top products and top states.
- P2DistributorA US map of where products are sold, with slicers for year, month, factory, state and division.
- P3Profit marginsRevenue and margin by year, division, product and factory.
05 · FINDINGS
What the report shows
- Revenue, orders, cost and margin, by month and year to date.
- The best-selling products and states, for targeted sales effort.
- How sales split across shipping modes.
- Which divisions, products and factories earn the strongest margins, and which lag.
- Where products are distributed across the US.
06 · RECOMMENDATIONS
What to do next
- 01Focus sales and marketing on the top states and products.
- 02Review the lowest-margin products and factories first.
- 03Use the shipping-mode mix to plan logistics costs.
- 04Use the map to plan territories and spot gaps for expansion.
07 · TECHNICAL CHALLENGES
Problems solved along the way
- CHALLENGE 1Many files, one modelRaw files were cleaned and merged in Power Query before modelling, so every page reads from the same tables.
- CHALLENGE 2Correct totalsA star schema with careful cardinality and cross-filter directions stops figures from being double counted.
- CHALLENGE 3One filter, every pageSlicers are synced across pages, so a chosen factory or state stays selected as you move through the report.
See it for yourself.
Open the live report →